Myths and realities of concrete performance and CO2 footprint
More strength requires a higher cement dosage
This idea from the conceptualization of cement as the glue that keeps concrete together as a solid material. Hence, more cement per cubic meter (binder content) is required to achieve higher strength of concrete for a given cement type. Another element is that within the mixture design process of concrete, the water dosage is usually fixed first based on workability considerations (for example, specified slump), and then the water-to-cement ratio (w/c) is established based on strength and durability specifications. This means that higher strength (lower w/c) means higher cement dosages. The reality is more complex and multifactorial, and in general, this is not necessarily the case particularly when modern superplasticizers are considered.
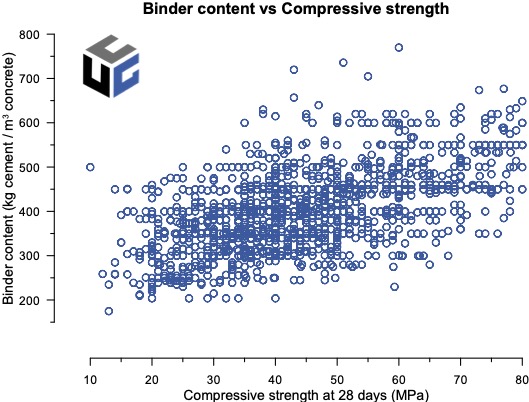
As seen in the figure, taken from more than a thousand concrete formulations published in the literature, there is no clear correlation between binder content and compressive strength. In other words, for a given specified strength, the scatter in binder contents are more than two-fold the lowest possible value.

Binder content versus compressive strength of concrete formulations published in the literature. Database can be accessed in the article by Hafez et al.
Higher strength concrete has inevitably a higher CO2 footprint
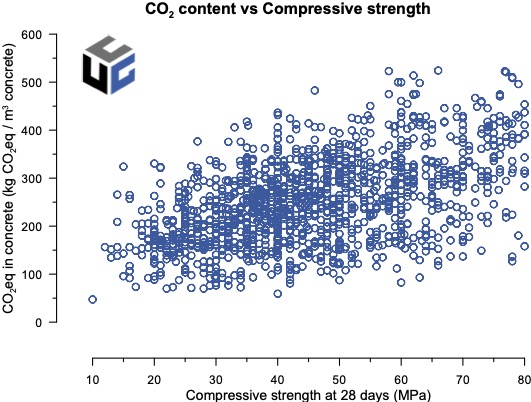
Closely linked to the point discussed above, there is no clear correlation between compressive strength and CO2 footprint of concrete. As in the case of the binder content, A significant amount of scatter is observed, and for a given strength the variations in embodied CO2 can be 4-fold. This not only shows that these two parameters are not intrinsically dependent on each other, but it also highlights the significant space for improvement and optimization in our concrete mixture design processes.

Embodied CO2 (kg CO2/m3 concrete, A1 to A3) versus compressive strength of concrete formulations published in the literature. Database can be accessed in the article by Hafez et al.
Higher slump implies a higher CO2 footprint of concrete
This idea presumes that water dosage is the only way to adjust the workability (slump) of a given concrete mixture. This is not the case, and there are several other factors that can influence the final flowability of concrete. In particular superplasticizers enable to reduce the water dosage significantly and preserve slump. In practice, this means that there is no correlation between concrete slump and the embodied CO2 of the material.

Embodied CO2 (kg CO2/m3 concrete, A1 to A3) versus concrete slump (Abrams cone test) of concrete formulations published in the literature. Database can be accessed in the article by Hafez et al.
Definition of thresholds for UGC based on its CO2 footprint
A useful way to represent the embodied CO2 of concrete and its performance (strength) is by normalizing the CO2/m3 in concrete by its compressive strength. This provides an overview on the amount of embodied CO2required to achieve a certain strength. This way of representing datasets also enable to establish thresholds that are valid for a variety of target strengths.
In this manner, two regions of interest are defined for the project.
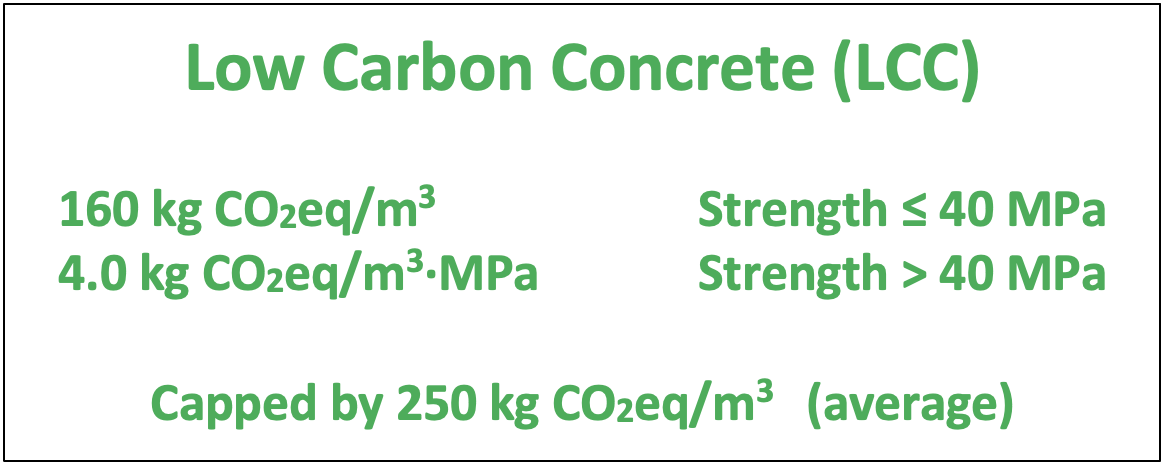
Low Carbon Concrete (LCC) as an intermediate step towards UGC, significantly better to the average concrete today (about 250 kg CO2eq/m3) but achievable with a direct implementation of technologies such as LC3.
Ultra-green Concrete (UGC) sets the bar higher and requires the implementation of both components of the two-fold strategy to be achieved. While technically challenging, trials show that it can be done, and this project will provide the knowledge and baselines to pursue the technological developments needed to materialize UGC.


Definition of Low Carbon Concrete and Ultra Green Concrete in terms of CO2eq/m3·MPa. Preliminary trial (non-admixture optimised) mixtures are shown in red. Database can be accessed in the article by Hafez et al.